
Create complex tooltips in Vue using ApexCharts

2022-05-27
3 min
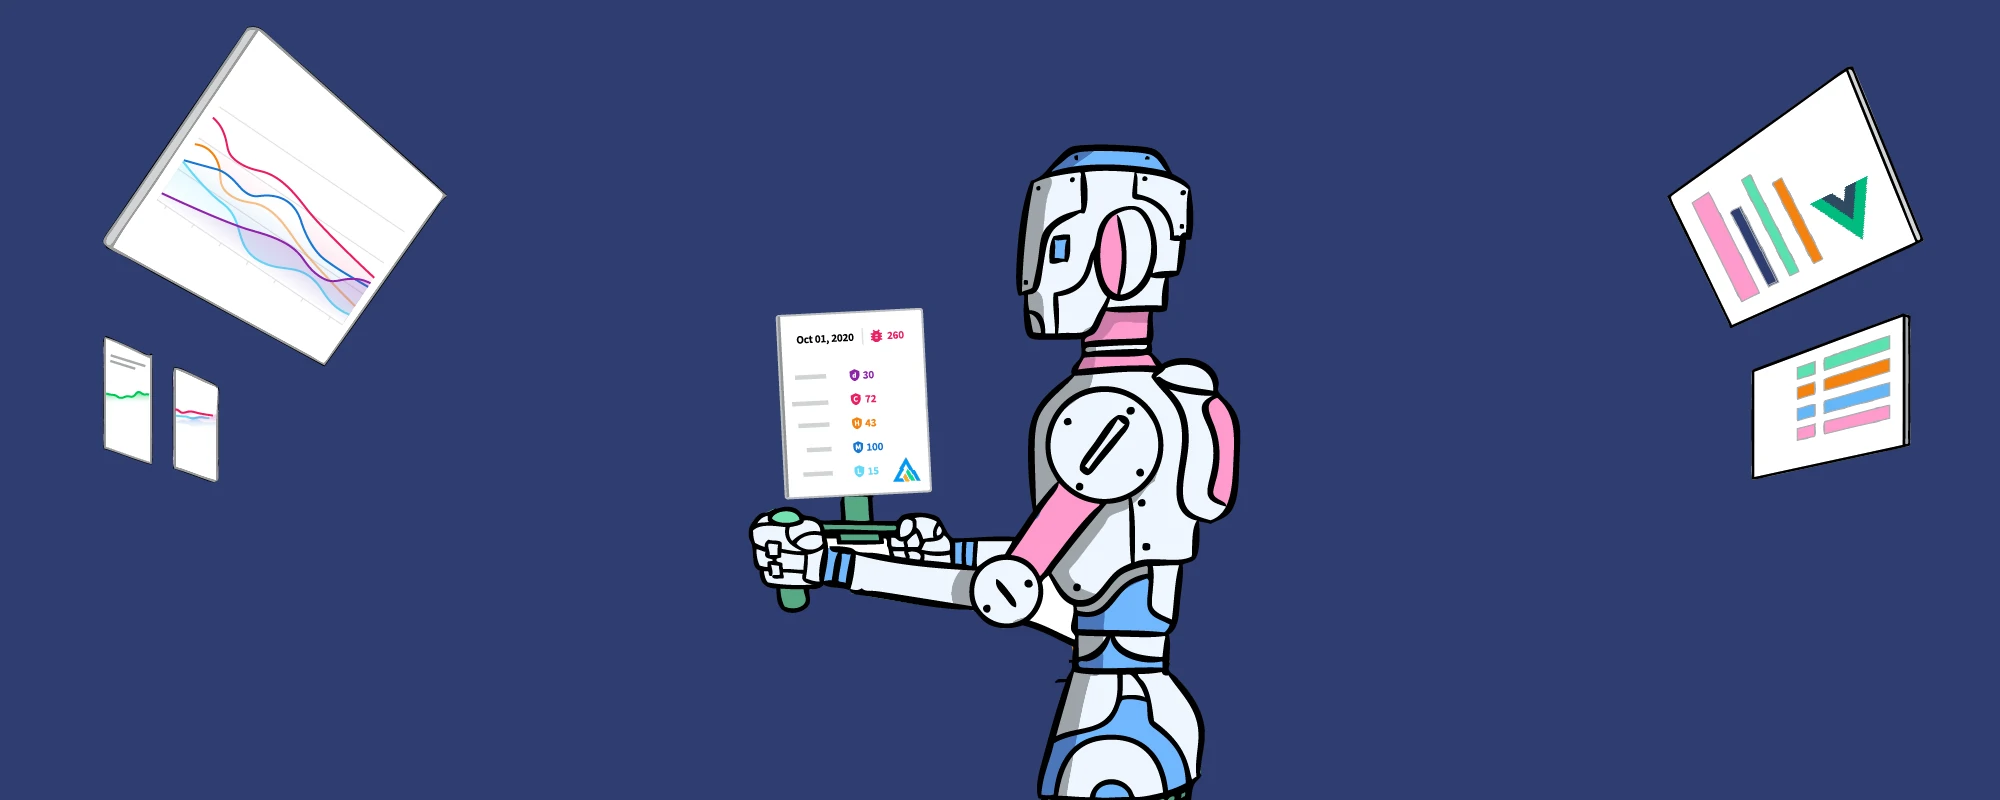
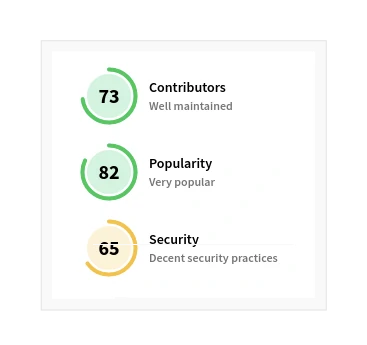
When developing Debricked’s Open Source Select security metric (now live on all package pages and comparison views!), we needed to extend the implementations of our charts to support more complex interactions.
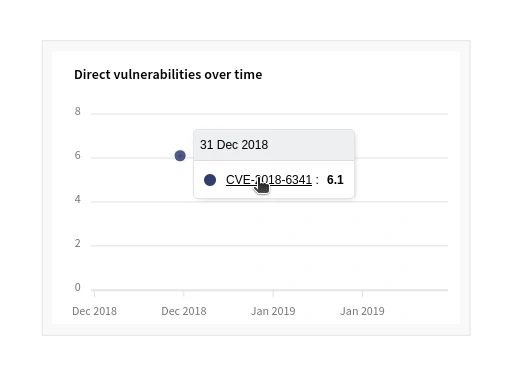
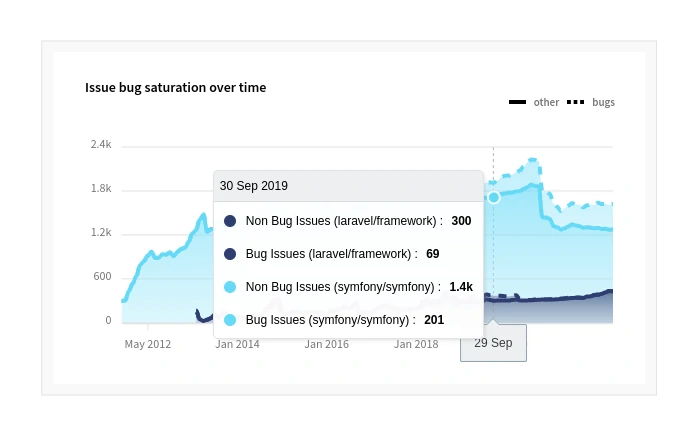
Our main focus was creating a custom interactive shared tooltip that would work with irregular time series. Most solutions require the custom tooltip function to return the entire tooltip, limiting the achievable complexity.
In this post, we will cover the general solution to creating custom interactive tooltips that work with irregular time series. We will also look at our implementation and how to have a more secure vue-like approach to tooltip creation!
The general solution
There is currently an opened issue on ApexChart’s GitHub to address shared tooltips with irregular time series. Our solution provides a workaround to this issue.
The main principle is to use the external tooltip function to pass the required data to your own tooltip component. In our case, all we needed was a position for the tooltip and the current index being hovered to show the corresponding data. Note that while the solution shown is meant to be implemented in Vue, the implementation for other frameworks supported by ApexCharts will not differ too much.
This external function can be added according to ApexCharts’s documentation as the `custom` key in the `tooltip` options.
tooltip: {
    shared: true,
    custom: ({
        series,
        seriesIndex,
        dataPointIndex,
        w,
    }) =>
        this.customSharedTooltip({
            series,
            seriesIndex,
            dataPointIndex,
            w,
        }),
},
In this function, we use the `seriesIndex` and `dataPointIndex` to extract the data from the x-axis and know which series happen to have a point at that coordinate.
customSharedTooltip({ series, seriesIndex, dataPointIndex, w }) {
    const hoverXaxis = w.globals.seriesX[seriesIndex][dataPointIndex];
    const hoverIndexes = w.globals.seriesX.map((seriesX, index) => {
        // We do not want to include hidden series in the tooltip info.
        if (
            w.globals.collapsedSeriesIndices.includes(index) === false
        ) {
            return seriesX.findIndex((xData) => xData === hoverXaxis);
        }
    });

    ...
As our charts allow users to collapse different series to hide them, we only want to consider the series which are not collapsed and have a value for the hovered x-index.
    ...
    const tooltipElements = [];
    hoverIndexes.forEach((hoverIndex, seriesEachIndex) => {
        if (hoverIndex >= 0) {
            const point = this.series[seriesEachIndex].data[hoverIndex];
            const element = {
                markerColor: w.globals.markers.colors[seriesEachIndex],
                value: w.globals.yLabelFormatters[0](
                    series[seriesEachIndex][hoverIndex]
                ),
                label: "",
                link: "",
            };
            if (point.notes) {
                element.label = point.notes.label;
                element.link = point.notes.link;
            } else {
                element.label = w.globals.seriesNames[seriesEachIndex];
            }

            tooltipElements.push(element);
        }
    });

    ...
By iterating over the `hoverIndexes,` we can extract the exact point from each series, the marker colour and the corresponding y-value.
ApexCharts’ custom tooltip function is expected to return HTML to be rendered, and while it is possible to simply build the HTML in this step, we opted for a more secure Vue-like approach.
Our implementation
Since we are all about security, we discovered that embedding the time series data in an HTML blob, to then be rendered by ApexCharts, would have opened the doors to a Cross-Site Scripting vulnerability. This means that we could have opened the doors to a Cross-Site Scripting vulnerability as we are inserting data from external sources, like GitHub.
To solve this and to have a more Vue-like implementation, we decided to store the tooltip information in a Vue data property which is then passed to a custom component as a prop.
tooltipConfig: {
    locked: false,
    title: "",
    elements: [
        {
            markerColor: "",
            label: "",
            value: "",
            link: "",
        },
    ],
},
The elements are set in the `customSharedTooltip` using the data extracted from the series.
...

this.tooltipConfig.elements = tooltipElements;
return this.$refs.tooltip.$el.innerHTML;
In the `customSharedTooltip` function, the data property is passed as a prop to the invisible custom component and rendered safely as a regular Vue component. The HTML is then extracted from it and returned. ApexCharts can then safely display the tooltip.
<custom-chart-tooltip
    v-show="false"
    :config="tooltipConfig"
    ref="tooltip"
/>
This component also allows for the time series points displayed in the tooltip to have a `link` property, making the tooltip clickable! You can also check out the full source code for this component and try it out for yourself!
Last words
While many impressive feats have been achieved with the power of divs and CSS combined, most front-end developers still prefer to work with existing in-house or open source components. We hope this guide helped you to implement your own fantastic custom tooltips in ApexCharts. And don’t forget to check out our own tooltip implementation in Select!


Nice blog!
Nice blog!