
What is Open Source Health?

2021-02-15
5 min

Debricked is approaching the question of how to score and determine the health of open source in a new data driven and quantitative way. What do we mean by Open Source Health?
Updated 2022: you can now learn more about open source health and health metrics in About Health section in our docs.
Introducing Open Source Health
When using open source in your software development, through frameworks such as NodeJS, Vue, React, TensorFlow, Symfony, Revel and so on, you need to be aware of certain potential risks.
Most people know about security vulnerabilities in open source and licensing & copyright issues. But there are other aspects that are crucial:
- How good is the community surrounding the project? Is it popular among users?
- Have the founders left the project?
- How good are they at resolving issues?
- and many more…
Before deciding to import a project, developers oftentimes google for 10-20 minutes, ask a colleague for his or her opinion and check the project’s GitHub page.
This strategy just barely works and could not be considered very scientific. Still, this is how it is traditionally done.
Declining ecosystems and dead projects
This process of investigating a component that is going to be used is often done without enough data and comparison. Single features often decide a developers selection.
A few months or years down the road it may turn out to be a dead project, or a fork has been made that you are not aware of.
There may be security vulnerabilities that are not reported properly in the project and let’s not even assume that it is going to show up in some vulnerability feed or database.
In summary, this could lead to a stale component in your software. And just like stale water is unhealthy to drink – stale open source components can create a black hole when you realise that there is no new version. No support to be had or that the ecosystem has totally abandoned your favourite projects for new and better technologies.
Current solutions that are good, but not perfect
The most famous one is probably the Chaoss project. The project had an interesting start in how you both can and should measure software and communities. Our model has been somewhat inspired by how they structured their models.
However, the Chaoss project is more focused on community management and analysis which is quite different from our approach.
While they are looking at tens of communities at the same time, we want to be able to compare any open source project in existence (tens of millions). With their data model and approach this was simply not feasible.
Our product is also not that focused on how to manage your open source community but rather on analysing the open source that you are using inside of your own software as dependencies.
Of course, our model can be used for both purposes in practice but we have had the computational efficiency and large scale open source comparison in mind when developing ours.
To be a bit more precise, looking at the Chaoss toolset they are more interested in qualitative metrics that give you certainty in the truth. For example one signal they use for determining the security of a project is by checking if it has an ISO certification.
This is undoubtedly a good signal for good security practices, but the vast majority of projects are not ISO certified, although they work a lot with security. So for most projects this doesn’t give any relevant information as you need to delve deeper to find things that correlate with security.
Data completeness and being quantitative
The above mentioned problem can be summarised as a data completeness challenge. What features in the data exist across all (or most) open source so that it can be easily compared? We need to be able to handle the missing data points and we need to create new entities within our model that are derived from data that exists for most open source.
This means that we are looking at a quantitative model where we try to find features that will together imply good security – rather than having a datapoint like ISO that is equivalent with security (but has bad completeness or coverage across all open source).
This is the reason why we call our approach more quantitative than qualitative. But we are not to say that one approach is better than the other. Ours is simply better suited for comparison of large open source software portfolios, like what you find in a modern software project with hundreds of dependencies.
The Debricked approach to open source health
We have created a model that is divided into three layers. From the bottom; data features, practices and metrics. The metrics are at the highest level of abstraction and could for example be; Popularity, Contributors, Maturity, Security etc.
These are useful to get a quick overview at some areas that we have trough research found important when evaluating open source. It also gives you the opportunity to roughly compare projects at a high level.
The next level, practices, are typically answers to questions you may seek. Is the core team active within a project? This is answered through our “Core team commitment” practice.
This is an example of a question which one single datapoint cannot answer. But we aggregate the underlying features in the data that imply this. This way we can try to answer the questions as best as possible.
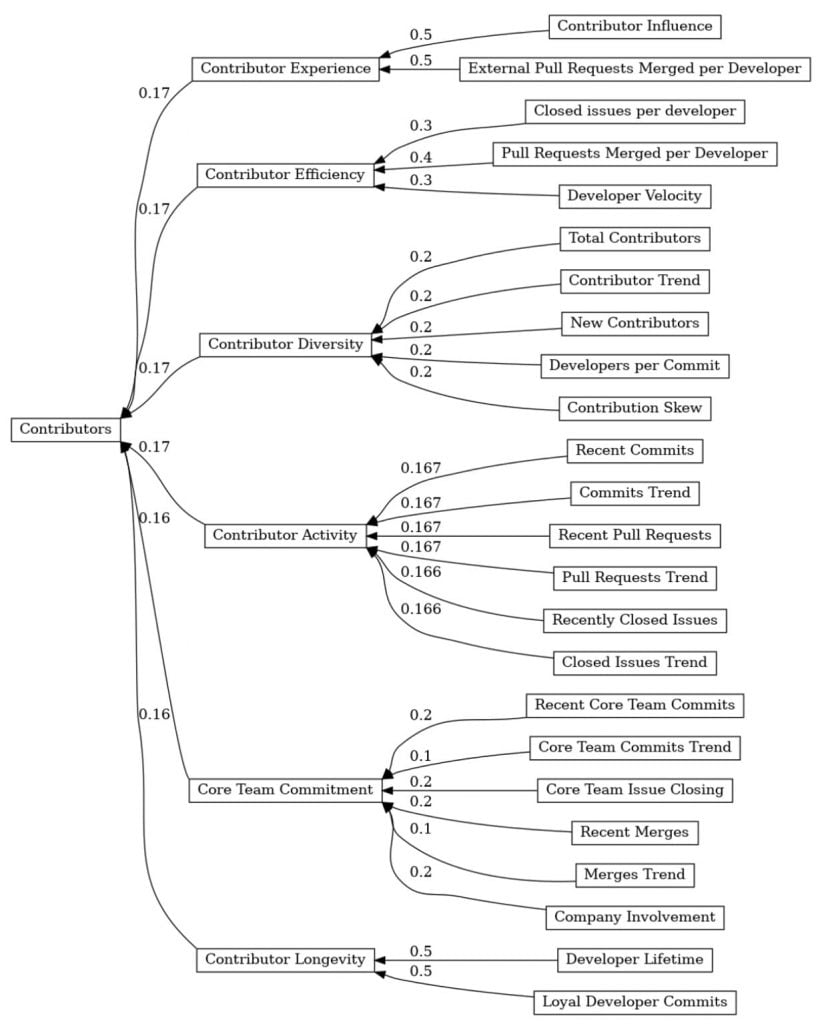
Example – Contributor Experience
We have conducted surveys on what developers look for when evaluating a project. One thing that is often investigated is the experience of the contributors of a project. Something that is quite complex and difficult to measure – without the analysis of quite a bit of data.
In our model this is built up out of the data features “Contributor Influence” and “External pull requests merged per developer”, as seen in the picture above.
In projects it may be beneficial to have high profile influential contributors that can bring new contributors to a project. Therefore, we have scraped all contributors and their followers. Then we multiply the number of followers by the number of pull requests the contributor has merged into the project.
We do this because contributors with a lot of followers may bring additional attention to the projects they contribute to. Because the contributor has a large influence, lots of developers will be made aware of both the contribution and the project. This in turn relates to contributor experience.
We also look at how many other projects this contributor contributes to and we exclude their private projects. All in all, it is easy to see that this becomes quite complex fast. The important part is how it correlates with the “subjective” view on contributor experience (or quality).
In total
When completed, we will have 100 features across our 24 practices and 6 high level metrics. These are in turn enabled by more than 40TB of data from GitHub and other sources such as Stack Overflow and package-managers. Read the article on how we are keeping a live mirror of GitHub at Debricked.
Becoming proactive
With the help of open source health, as implemented in our tool, we can help developers pick the right open source from the start. Using healthy and well maintained open source is key to building high quality, sustainable software that is more easily managed and overall works better. Read more about ope
If you are interested in gaining access to our open source health data, you may contact Sales. The data will also be available and actionable in the Debricked tool and user interface during 2021, so stay tuned.